
Overview
Chaos Labs is pleased to provide a comprehensive review of the second trading season on the dYdX Chain. This analysis encompasses all facets of exchange performance, emphasizing the impact of the Launch Incentive Program.
We are diligently fine-tuning the incentives, ensuring they effectively meet their intended goals. We aim to understand the rewards program’s dynamics and outcomes by monitoring a broad spectrum of indicators.
Key Stats:
- dYdX Chain has seen over $33 billion in trading volume across 39 live markets. This is an increase of 245% on season 1 volumes.
- Over 3200 traders actively earn points through the launch incentive program. This is up over 41%.
- Funding rates in most major markets have become more subdued, demonstrating market maturity.
- The dYdX Chain has grown to approximately $57m USDC in TVL.
dYdX Chain Trading
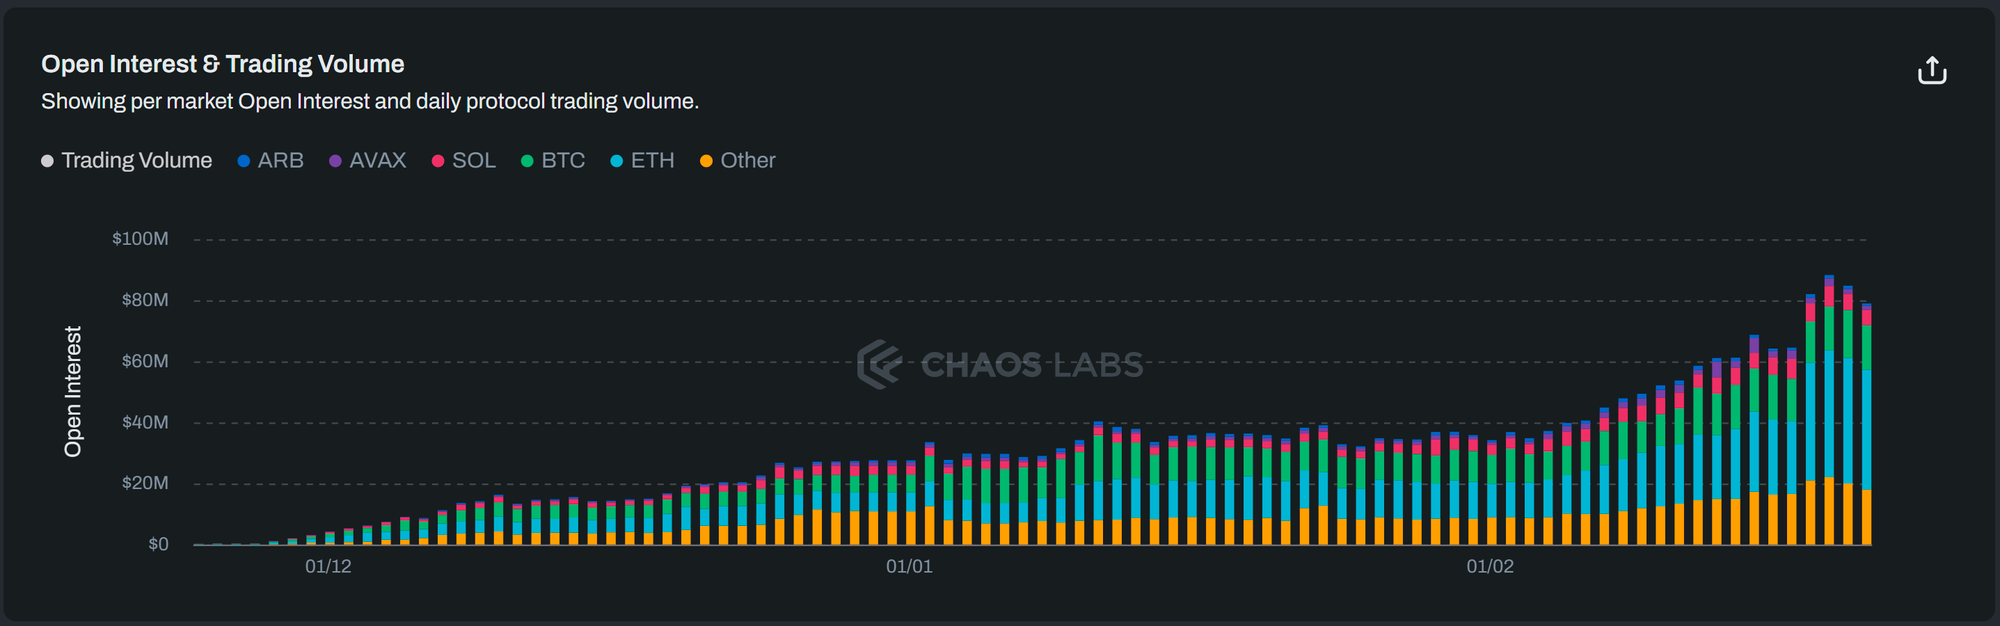
There has been over $33bn in trading volume across the 39 live markets in season 2, up 245% on season 1. These volumes compare favorably to the $26bn on dYdX v3 over the period.
The launch incentive program’s focus on rewarding traders migrating their activity to the dYdX Chain early has had a significant effect as daily volumes have continued to trend higher.

Equally impressive is the growth in open interest, which has grown 165% this season from $30m to $80m. This growth in open interest could result from traders putting more weight into trading performance to rank high in the four trading leagues.
And there have been some incredible trading performances in the leagues. The leagues are intended to motivate traders to invest their time and energy into improving their trading performance. This leads to them gaining more enjoyment and utility from the dYdX Chain. Below, we provide trading league overviews:
Platinum Trading League

Gold Trading League

Silver Trading League

Bronze Trading League

Since inception, traders have paid almost $7m in fees to stakers securing the dYdX Chain. $5.4m of this came in season 2 of the launch incentive program.

dYdX Chain Liquidity
Liquidity in the majors, as measured by median liquidity within 100bps, has improved significantly over season 2. In long-tail assets, order book liquidity is becoming more varied by the market, perhaps shifting to where it is most in demand.

Funding Rates
Average funding rates in most major markets have reduced over season 2. Surges in funding rates still occur, but the mean-reversion characteristic of the funding rates is getting much more substantial, indicating healthier, more mature markets.

Liquidations
A total of $23.7m in liquidation volume occurred during season 2 of the Launch Incentive Program. This is much lower than during season 1 when normalized for average volumes and open interest.
Lower market volatility and more responsible traders targeting trading league performance are the likely significant contributors.
These liquidations added approximately $240k to the insurance fund, now at $1.58m.

TVL and Deposit Metrics
USDC deposits continue to grow, providing a potential leading indicator to further growth in trading volumes.
Approximately 57m USDC is currently deposited on the dYdX Chain, up from 30m USDC at the start of the season.
Much room remains to grow towards the approximately $300m TVL in dYdX v3.
Program Efficiency Metrics
Much of the above analysis focuses on aggregate metrics, which few traders can influence. Our analysis of the program also encompasses a bottom-up assessment of the impact it has in growing the number of active traders.
This section provides a deep dive into trader-level metrics to highlight the program’s impact across various dimensions. This, in turn, forms the basis for the long-term projections around the program’s impact and efficiency.
Daily and Weekly Active Traders
The number of weekly active traders has grown to over 1600 last week. After an initial volatility-driven slowdown in weekly active traders, we have seen a recent surge despite only a moderate uptick in volatility.
Growing the number of average daily and weekly active traders on dYdX is a guiding principle of the Launch Incentive Program, and significant care is taken to ensure that the incentives appeal to a diverse segment of traders.

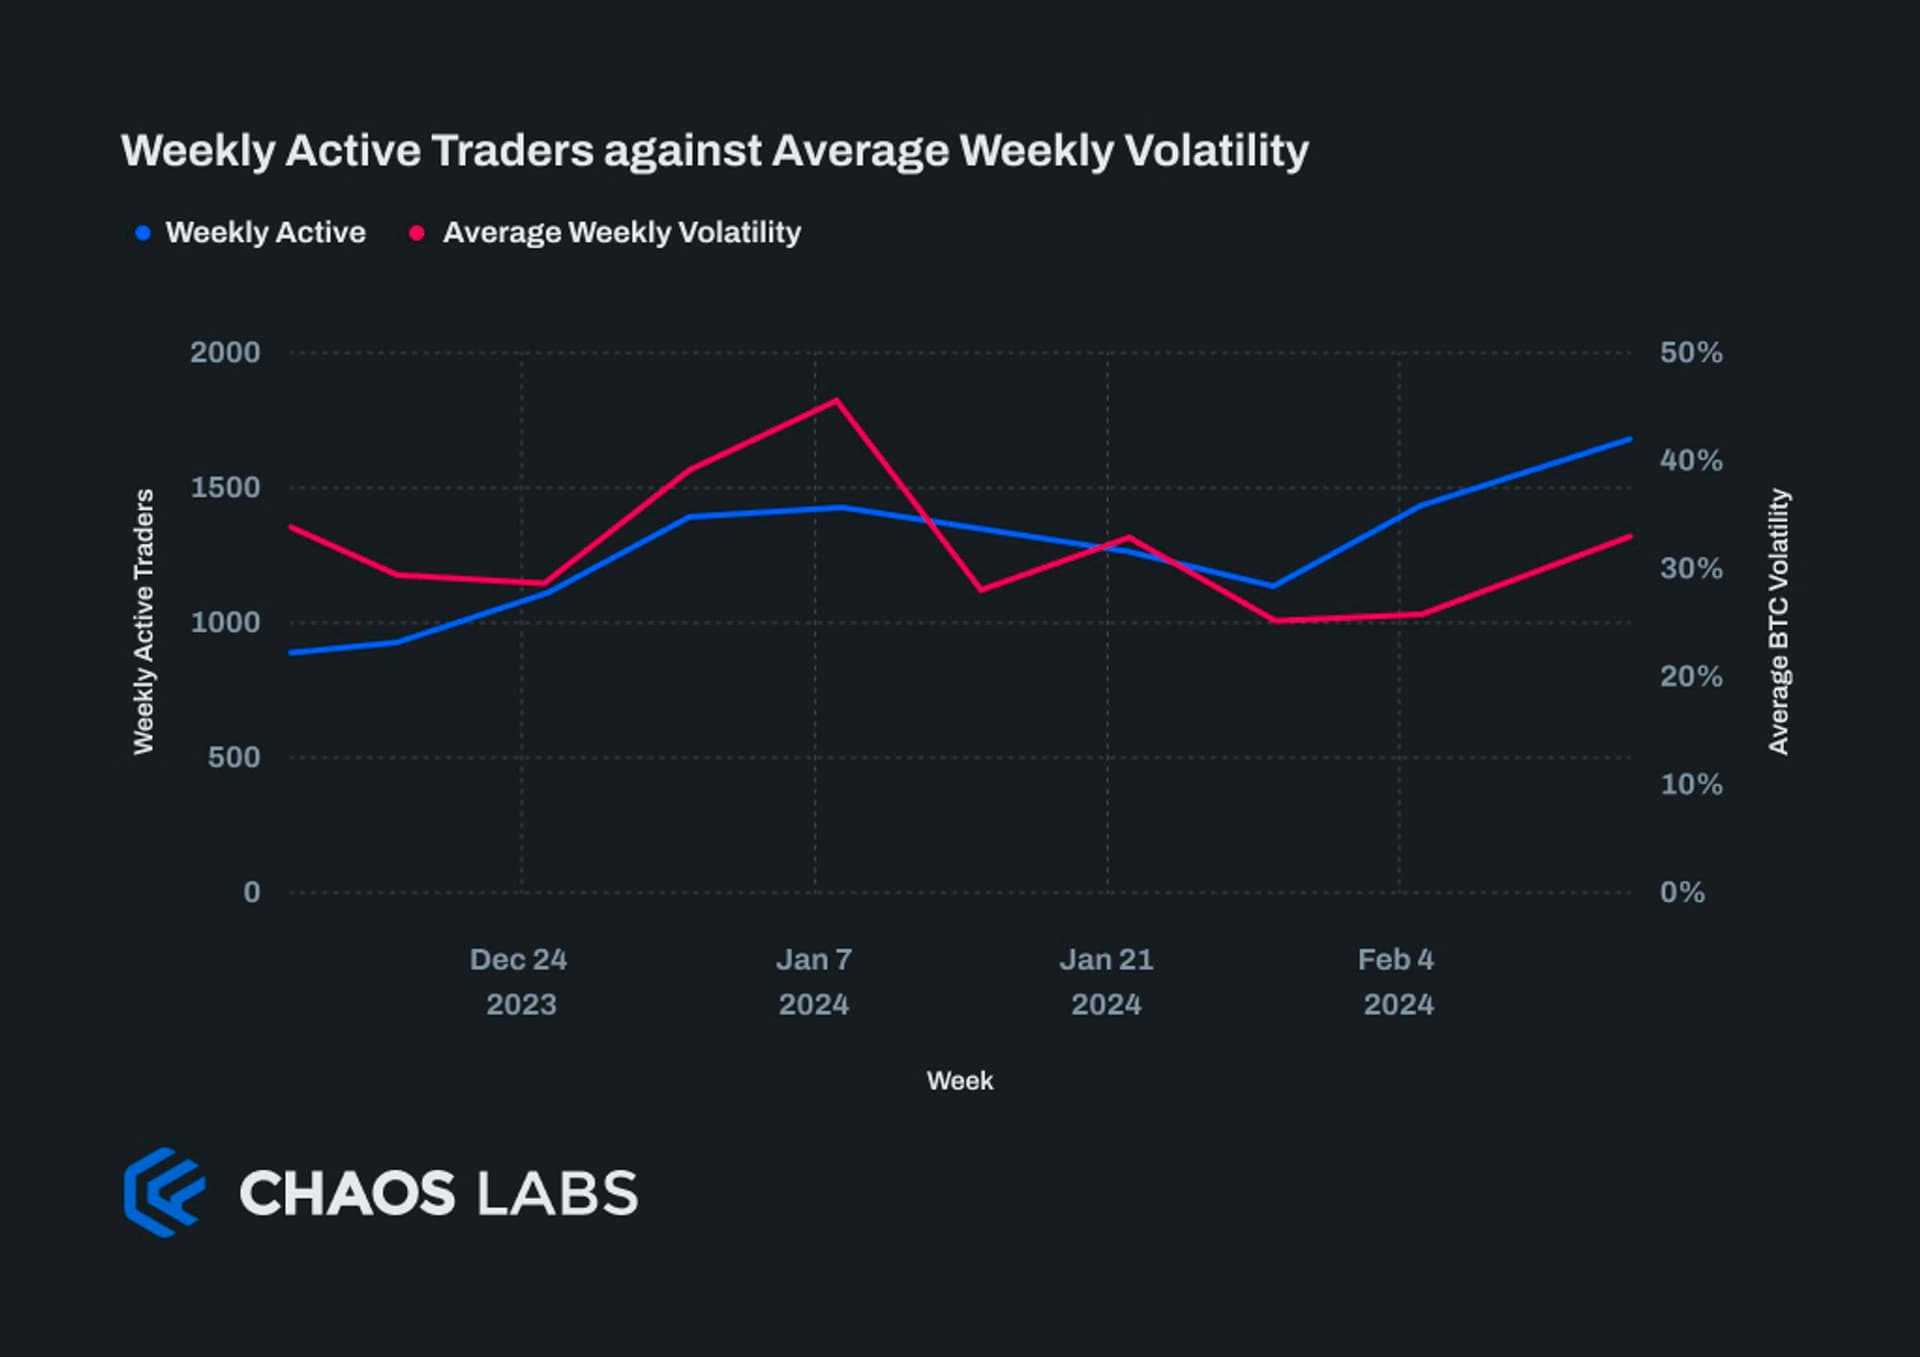
- Weekly active traders make at least one trade a week.
- Volatility is measured as the variance of minute-by-minute log returns of BTC. This short time frame accurately measures the volatility experienced by dYdX Chain traders in its largest market better than the traditional daily volatility.
Trader Engagement
Trader engagement is defined as how frequently the active user interacts with the dYdX Chain. This is analyzed across a few dimensions. The ratio of average daily active users to weekly active users broadly signals what portion of weekly active traders make a trade on a given day in the week. When this ratio is high, more traders find value in the product and return for this utility.
From a Launch Incentive Program perspective, the incentives should appeal to traders who are likely to become more regular traders and, therefore, likely to be stickier over the long term.
This ratio has remained steady between 38% and 45% since early season 1, tracking volatility closely. The relatively high level for an exchange indicates that a sizable segment of users are finding value and sticking around to use the dYdX Chain for their trading.

Another measure analyzed is the number of days traders have been active during season 2.
This long-tailed distribution is typical of trading exchanges. We take encouragement that only 21% of traders traded on a single day and 15% on two days. Most traders are trying out the dYdX Chain over multiple days, potentially aspiring to score well in one of the trading leagues.
Data on the number of days each trader has been active in season 2 drops off quickly from 1 day to 7 days before flattening out significantly. 13% of traders have traded on at least half the days this season. 44% have traded at least five times.
There have been 38 traders active every day this season so far. 325 traders, making up over 10% of the total, have been active on at least half the trading days in season 2.

Weekly Trader Breakdown and Retention
Impressively, there continue to be new traders onboarding to the dYdX Chain over 12 weeks into the Launch Incentives Program. Between 200 and 400 new traders enter the ecosystem each week, and growing this segment further will be a focus in season 3.
The nature of a trading exchange makes retention metrics challenging, as there can be cases of traders missing a week but remaining loyal users. To avoid mismeasurement of these traders as a churn (as one would in a SaaS business, for example) while retaining granular measurement of weekly behavioral trends, we separate retained traders (traded in the previous and current week) and returned traders (traded in at least one week before the previous, and the current week). This highlights the compounding nature of growing these engaged users as the base grows due to their relatively lower churn than newer traders.


The marginal weekly trader retention rate shows how likely it is for a trader who has traded for a certain number of weeks to trade for one more. This is a slightly different methodology from the retention rate above, as returning traders are treated the same as retained traders, hence the higher retention numbers.
What is apparent is how much better traders retain the more weeks they have been active. The goal is to get a trader active for at least six weeks, as the data suggests traders are incredibly sticky.
This also quantitatively represents what the Launch Incentive Program intends to achieve. Bring traders on board who come from the rewards but end up staying for the utility of the dYdX Chain.

Summary
Many aspects have contributed to the growth of the dYdX Chain since the Launch Incentive Program began. Attributing growth to specific
- Stakers have earned over $5.4m in fees during season 2; the program will pay out $5m in rewards.
- Traders who trade for six weeks or more retain at over 90%. The impact of trader acquisition from the rewards will be felt long after the program ends.
- Over 4300 traders have used the dYdX Chain since the beginning of season 1.
